Parametric Design

#Code #Datavisualisation #Input-Output

This project offered an accessible and playful introduction to creative coding with JavaScript. The open-ended structure encouraged hands-on experimentation, visual exploration and collaborative problem-solving. Working with parametric design (in the context of code) unlocked new ways of thinking about design systems — where creative control meets mathematical logic. By adjusting variables and visual parameters in real time, I discovered how code can become a flexible design tool that enables responsive, dynamic and highly individual outcomes.

My goal was to design an interactive tool for playful data visualization using spirographs. Inspired by analog drawing sets and mathematical principles, the concept explores how visual patterns can represent personal data such as time spent, topic complexity and focus intensity. The tool invites users to track daily habits or intentions through generative design and parametric input.

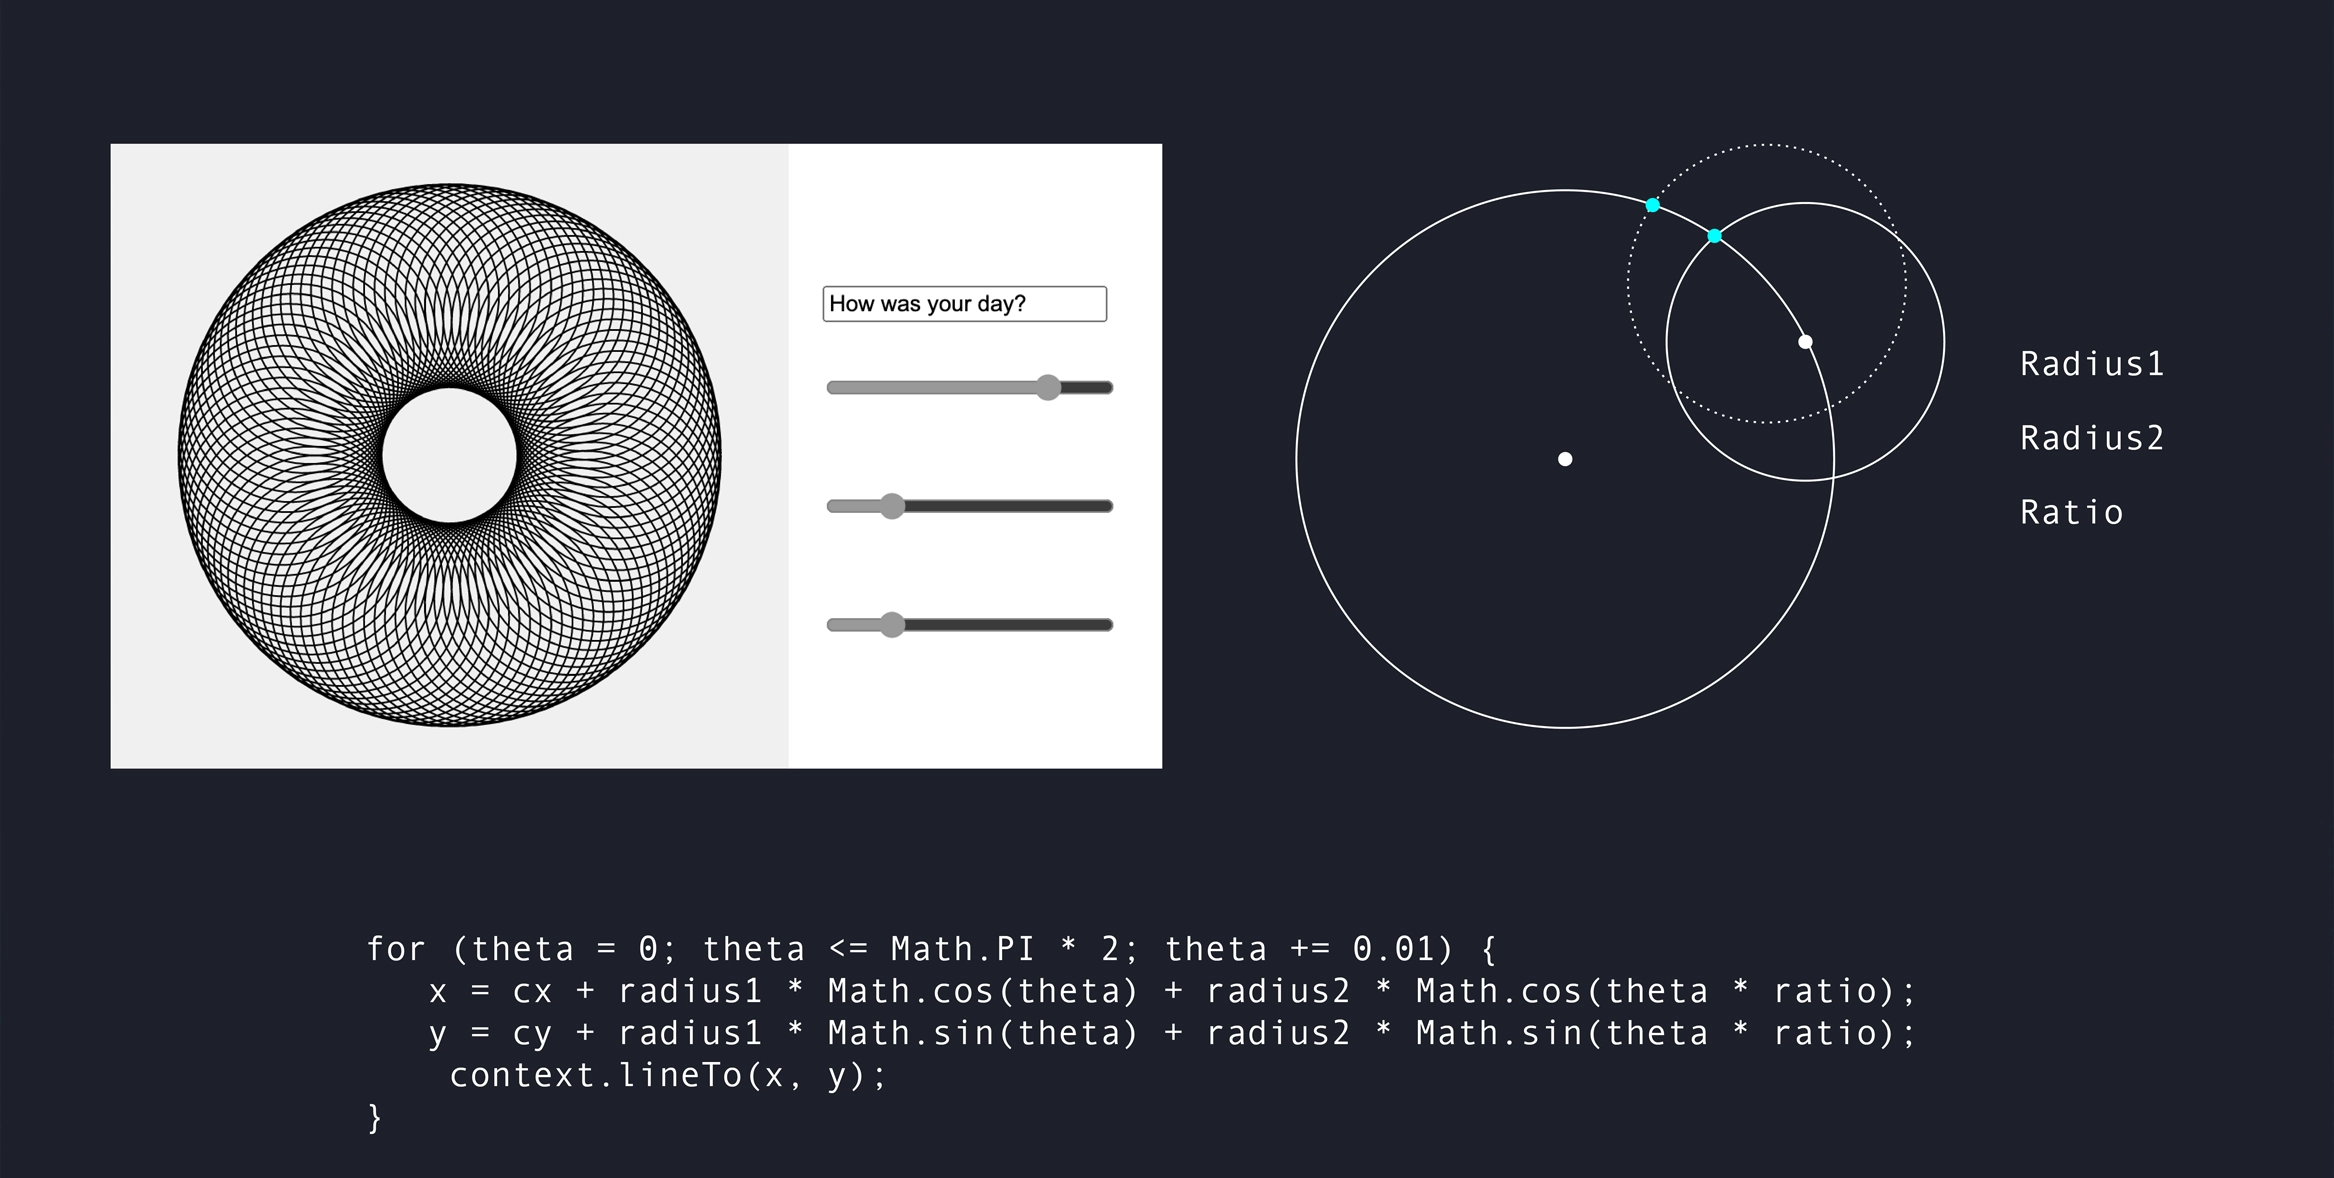
Starting with simple exercises in JavaScript, the project evolved around the use of sliders as interactive parameters. Each slider was linked to a specific part of the spirograph formula, influencing aspects like size, density and expansion.
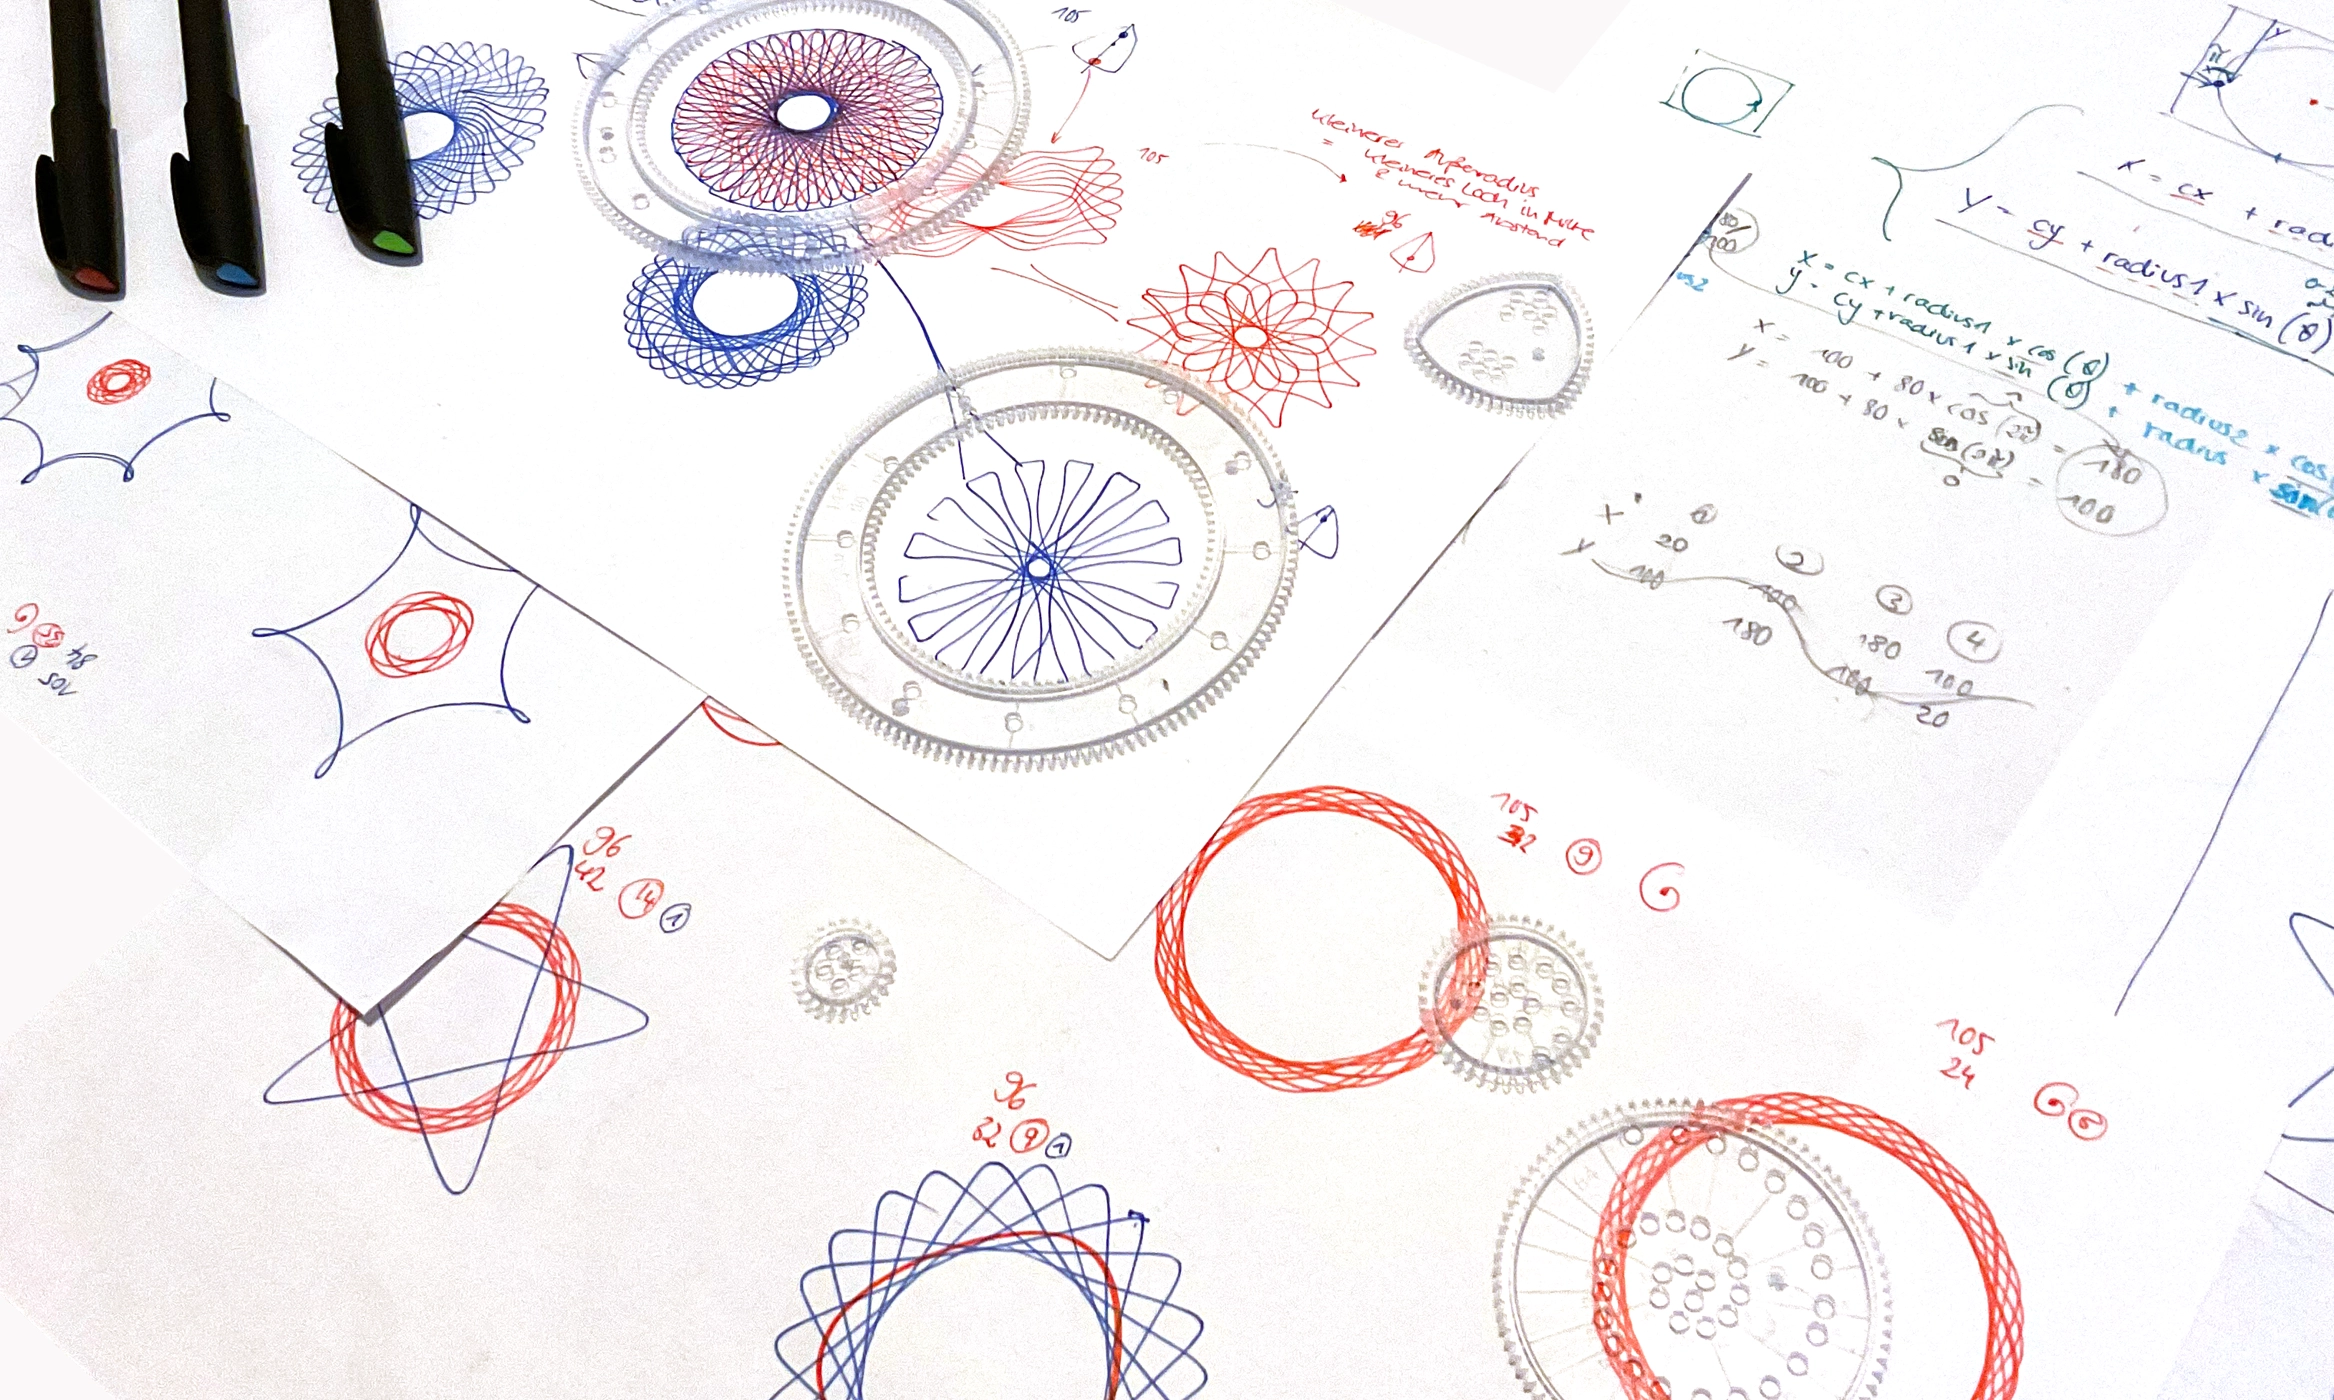
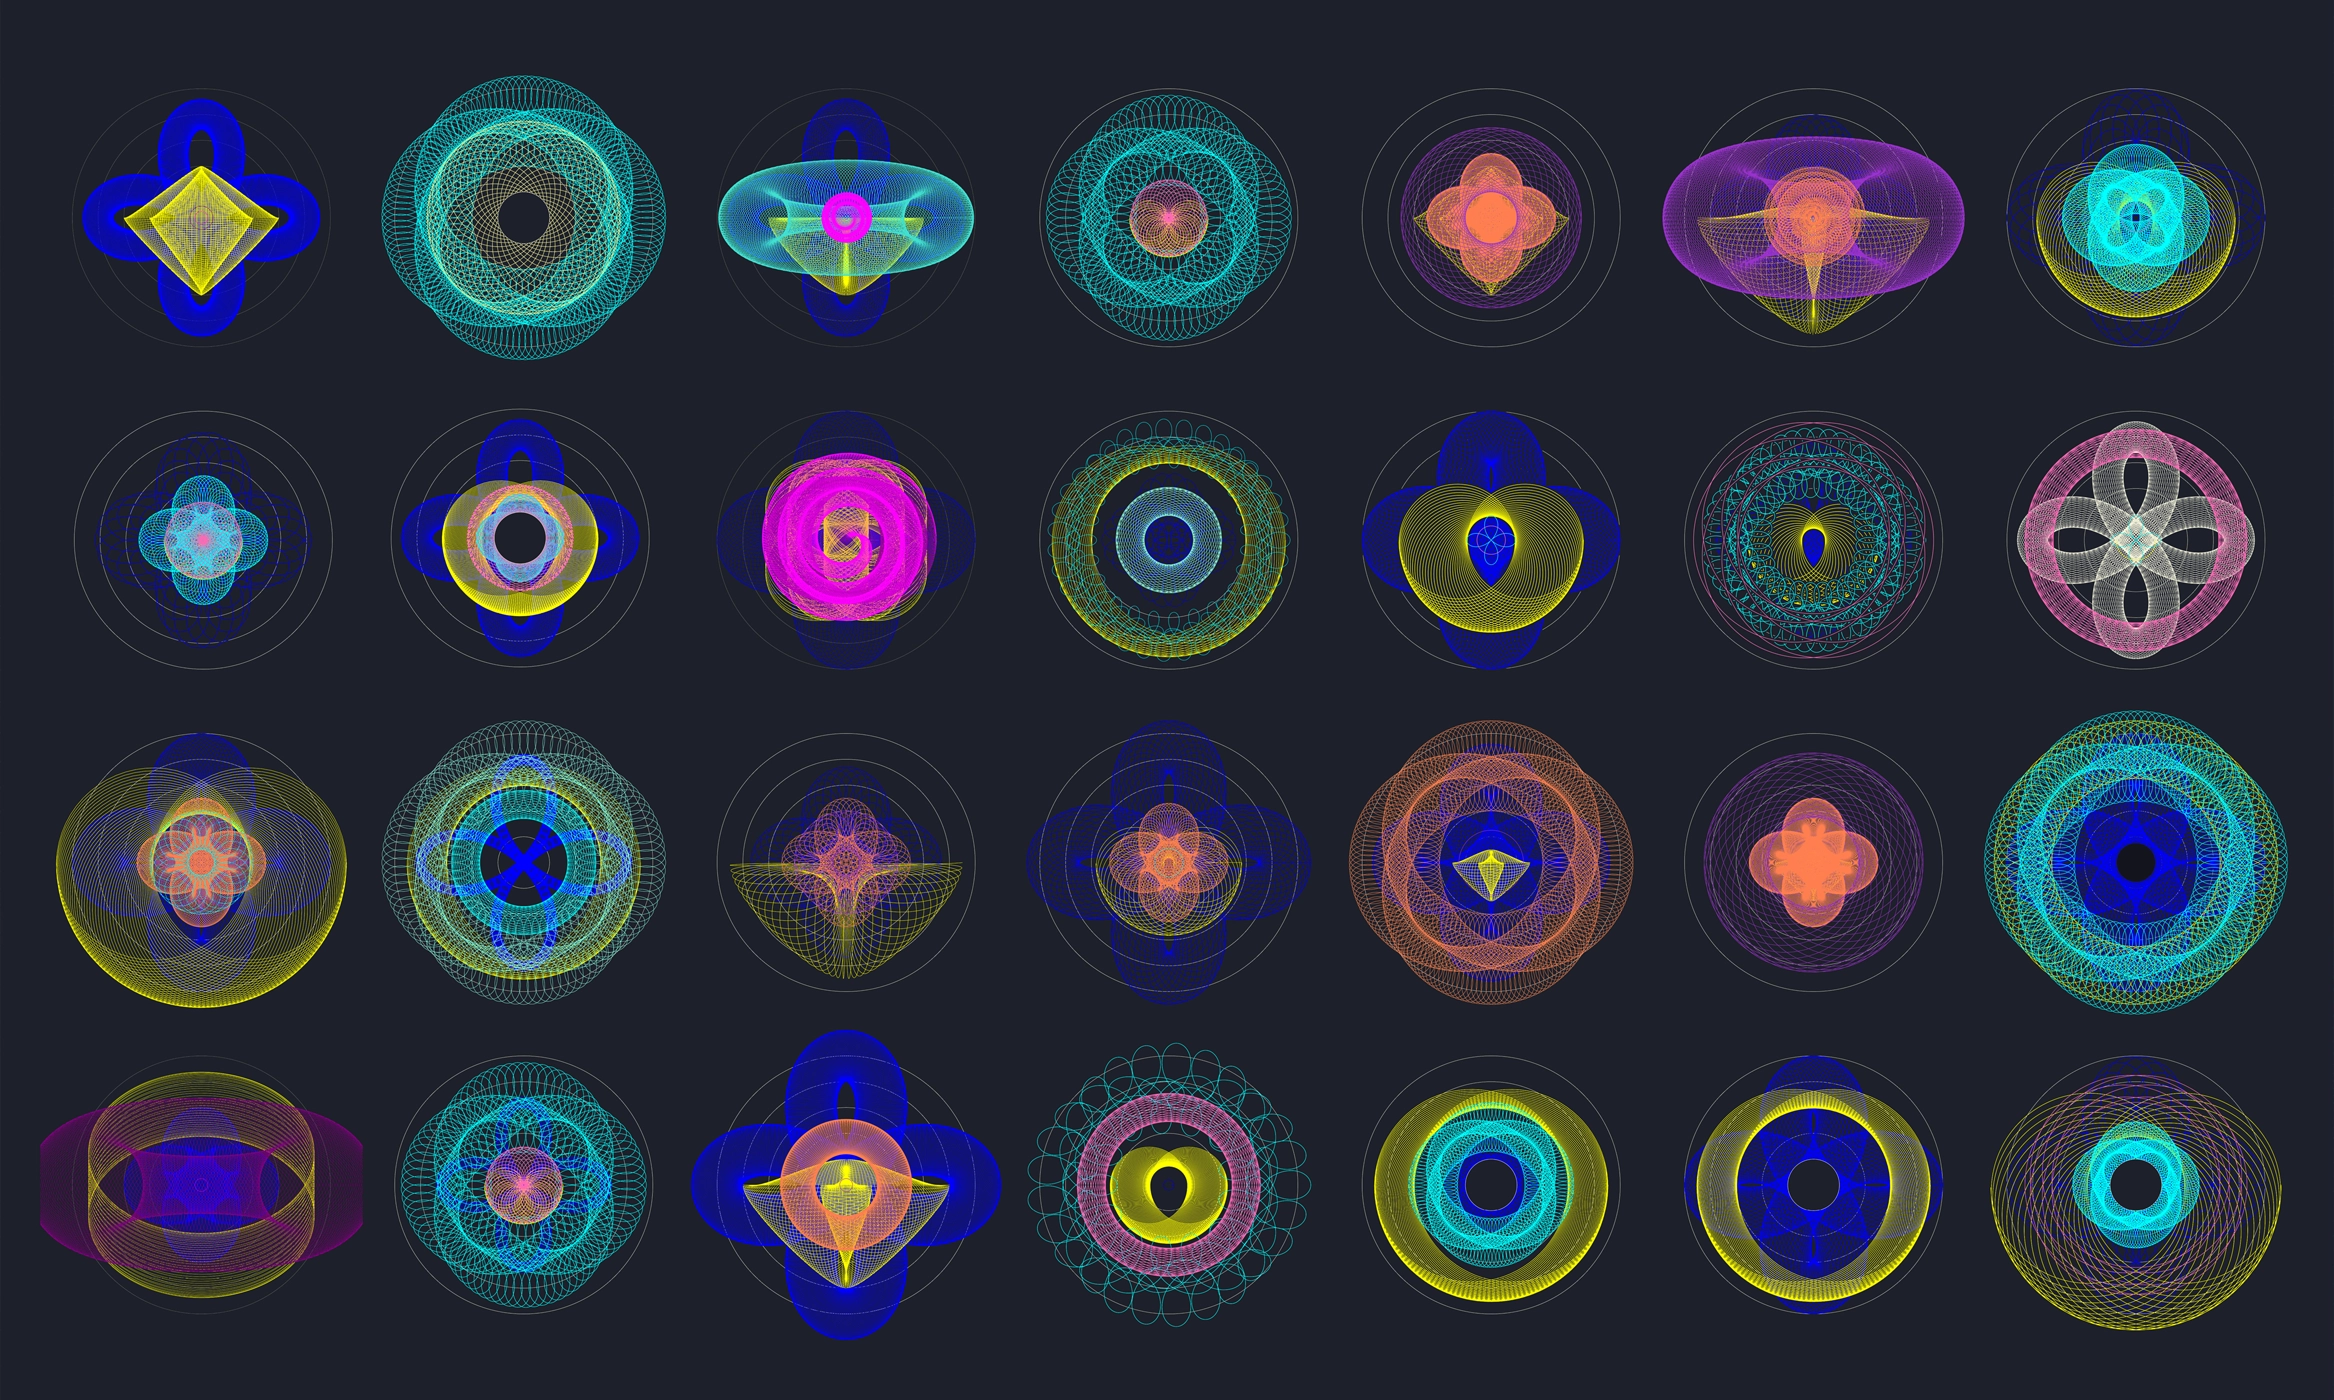
To better understand the visual logic behind the mathematical structures, analog tools were used in parallel. The visual design was refined through extensive testing, layering multiple spirographs and experimenting with stroke, color and transparency to achieve a clear, readable and aesthetically engaging result. The biggest challenge was to ensure a meaningful and consistent relationship between input values and visual output.

Visual Studio Code, html / css / JavaScript (p5.js), analog spirograph set


University of Applied Sciences Potsdam (2022/23),
Mentor: Prof. Dr. Sebastian Meier

Math meets code

To get a better understanding of the digital construction of spirographs using code, I started with adjusting basic mathematical formulas.

Visual results during process

Scroll to Top